Reports & Analytics
YAQRSA provides robust, real-time analytics to help you understand how your participants are interacting with your hunts and physical locations. This guide covers the two main reporting dashboards available to you.
Hunt Reports
Every active or archived hunt has a dedicated Report dashboard. This shows you exactly how a specific event is performing.
- Navigate to My Hunts.
- Click the Chart Icon (View Report) on any given hunt row.
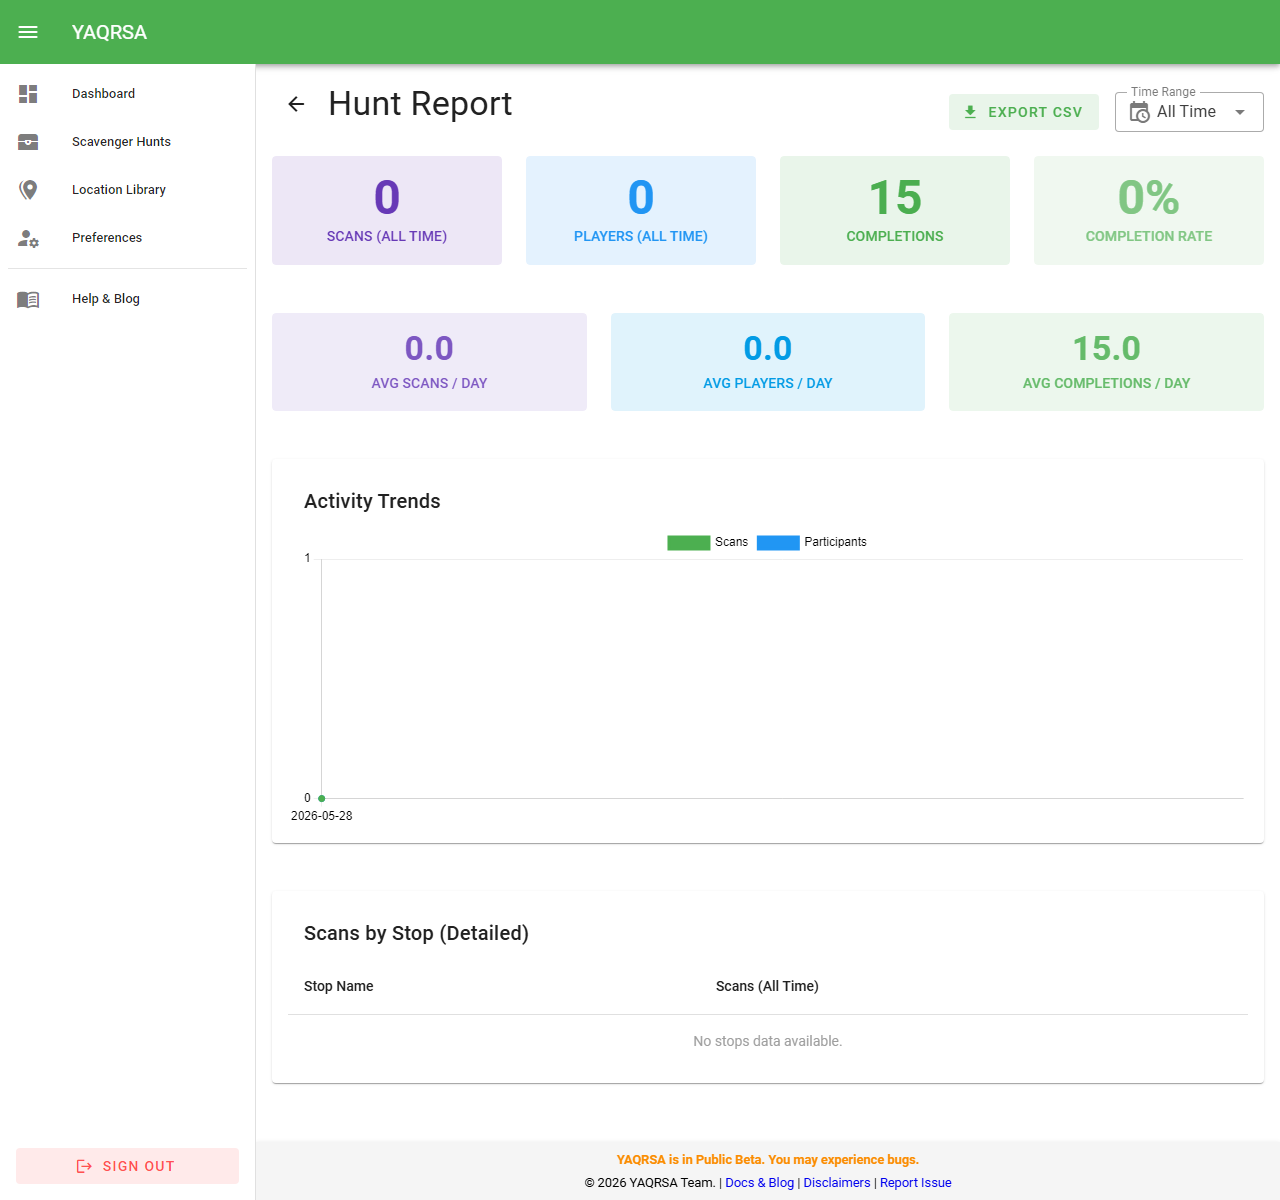
Dashboard Features
- Time Range Filter: At the top right, use the dropdown to filter the data. You can view metrics for Today, Yesterday, Last 7 Days, Last 30 Days, or All Time.
- Key Metrics Overview:
- Total Scans: The raw number of times any QR code in this hunt was scanned. The small sub-text shows the count strictly within your selected time range.
- Participants: The number of unique players/teams who joined the hunt.
- Completion Rate: The percentage of joined participants who successfully met the hunt's completion conditions.
- Busiest Stops Chart: A visual bar chart that clearly illustrates which locations are being discovered the most. This is excellent for identifying "bottlenecks" in a sequential hunt or the most popular exhibits in a free-roam hunt.
- Scans by Stop Table: A detailed tabular breakdown of the chart data, showing exactly how many scans each individual stop received.
Location Analytics
While Hunt Reports show data for a specific game, Location Analytics show you the lifetime performance of a physical spot across all the hunts it has ever been used in.
This is particularly powerful if you use Permanent QR Codes in Location Mode. You can track the foot traffic to a permanent sign over months or years, regardless of which seasonal hunt is currently active.
- Navigate to your Location Library.
- Click the Chart Icon (View Report) on a location row.
Analytics Features
- Total Historic Visits: The absolute number of times this location has been scanned since it was added to the library.
- Hunt Breakdown: A pie chart or list showing which specific Hunts are driving the most traffic to this location. (e.g., You might see that the "Summer Hunt" brought 500 scans to your fountain, while the "Winter Hunt" only brought 50).
- Time Filtering: Just like Hunt Reports, you can filter this data to see recent trends.
Exporting Data
For offline tracking and reporting, you can export your hunt's highest level metrics to tools like Excel or Google Sheets.
- Open any Hunt Report.
- Look for the Export CSV button in the top right corner.
- Clicking this will automatically generate and download a
.csvfile containing your daily performance metrics.
The CSV Export includes:
- Date: The day the activity occurred.
- Total Scans: The number of times any QR code in this hunt was scanned on that date.
- New Participants (Joins): The number of unique players/teams who started the hunt on that date.